
Welcome to Day 7 of 21 Days of AWS using Terraform. Topic for today is Introduction to CloudWatch using terraform.
What is CloudWatch?
AWS CloudWatch is a monitoring service to monitor AWS resources, as well as the applications that run on AWS.
As per official documentation
Amazon CloudWatch monitors your Amazon Web Services (AWS) resources and the applications you run on AWS in real time. You can use CloudWatch to collect and track metrics, which are variables you can measure for your resources and applications.
Reference
https://docs.aws.amazon.com/AmazonCloudWatch/latest/monitoring/WhatIsCloudWatch.html
EC2/Host Level Metrics that CloudWatch monitors by default consist of
- CPU
- Network
- Disk
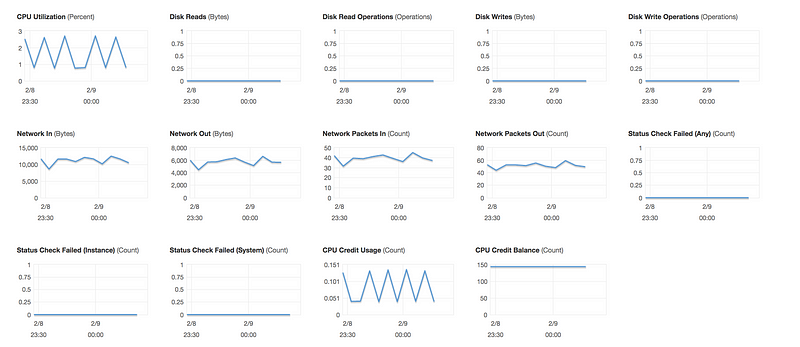
- Status Check

There are two types of status check
- System status check: Monitor the AWS System on which your instance runs. It either requires AWS involvement to repair or you can fix it by yourself by just stop/start the instance(in case of EBS volumes).Examples of problems that can cause system status checks to fail
* Loss of network connectivity
* Loss of system power
* Software issues on the physical host
* Hardware issues on the physical host that impact network reachability
- Instance status check: Monitor the software and network configuration of an individual instance. It checks/detects problems that require your involvement to repair.
* Incorrect networking or startup configuration
* Exhausted memory
* Corrupted filesystem
* Incompatible kernel
NOTE
- Memory/RAM utilization is custom metrics.
- By default, EC2 monitoring is 5 minutes intervals but we can always enable detailed monitoring(1 minutes interval, but that will cost you some extra $$$)
Reference
https://aws.amazon.com/cloudwatch/pricing/
P.S: CloudWatch can be used on premise too. We just need to install the SSM(System Manager) and CloudWatch agent.
Enough of the theoretical concept, let setup first CloudWatch alarm
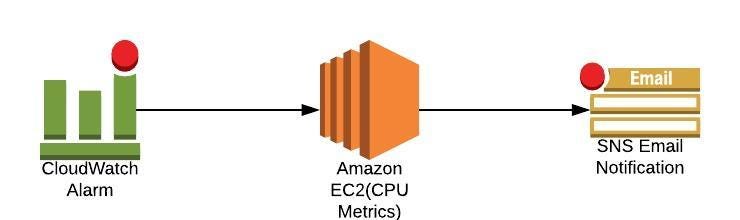
- Scenario1: We want to create a CloudWatch alarm that sends an email using SNS notification when CPU Utilization is more than 70%
- Setup a CPU Usage Alarm using the AWS Management Console
- Open the CloudWatch console at https://console.aws.amazon.com/cloudwatch/.
- In the navigation pane, choose Alarms, Create Alarm.
- Go to Metric → Select metric → EC2 → Per-Instance-Metrics → CPU Utilization → Select metric
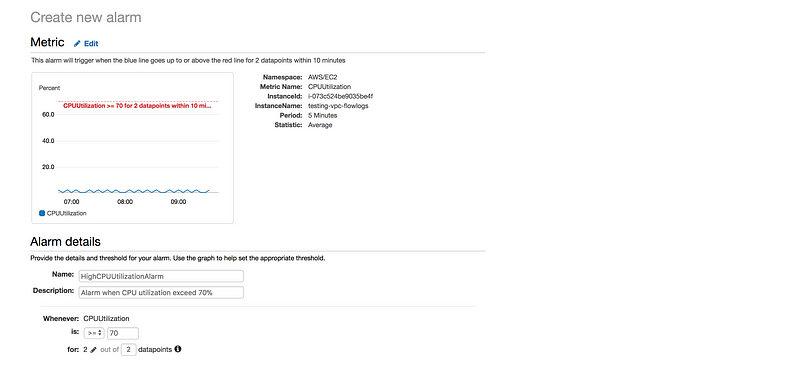
Define the Alarm as follows
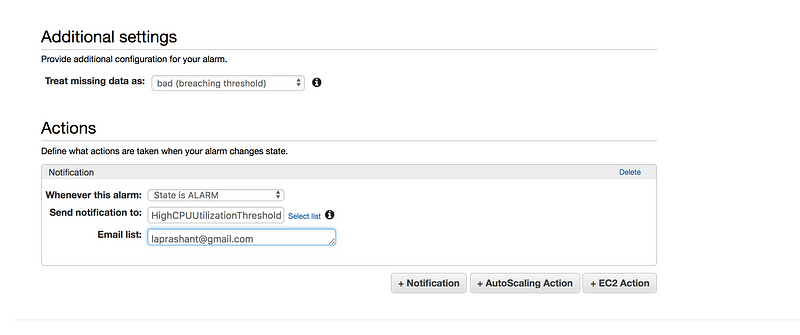
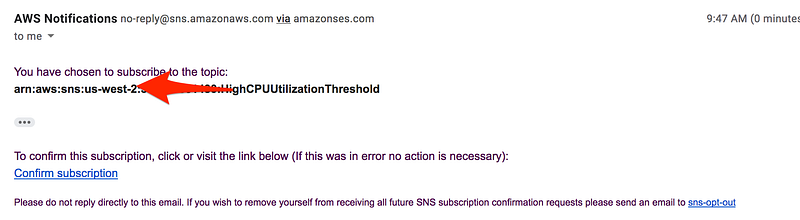
* Type the unique name for the alarm(eg: HighCPUUtilizationAlarm)
* Description of the alarm
* Under whenever,choose >= and type 70, for type 2. This specify that the alarm is triggered if the CPU usage is above 70% for two consecutive sampling period
* Under Additional settings, for treat missing data as, choose bad(breaching threshold), as missing data points may indicate that the instance is down
* Under Actions, for whenever this alarm, choose state is alarm. For Send notification to, select an exisiting SNS topic or create a new one
* To create a new SNS topic, choose new list, for send notification to, type a name of SNS topic(for eg: HighCPUUtilizationThreshold) and for Email list type a comma-seperated list of email addresses to be notified when the alarm changes to the ALARM state.
* Each email address is sent to a topic subscription confirmation email. You must confirm the subscription before notifications can be sent.
* Click on Create Alarm
Scenario2: Create a status check alarm to notify when an instance has failed a status check
Creating a Status Check Alarm Using the AWS Console
- Open the Amazon EC2 console at https://console.aws.amazon.com/ec2/.
- In the navigation pane, choose Instances.
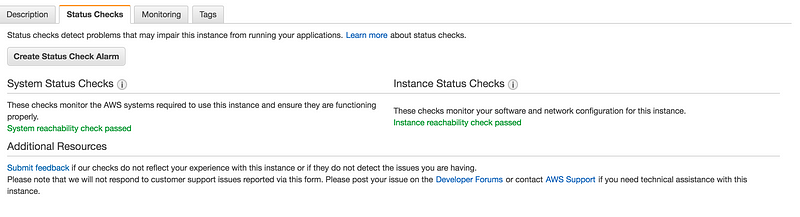
- Select the instance, choose the Status Checks tab, and choose to Create Status Check Alarm.
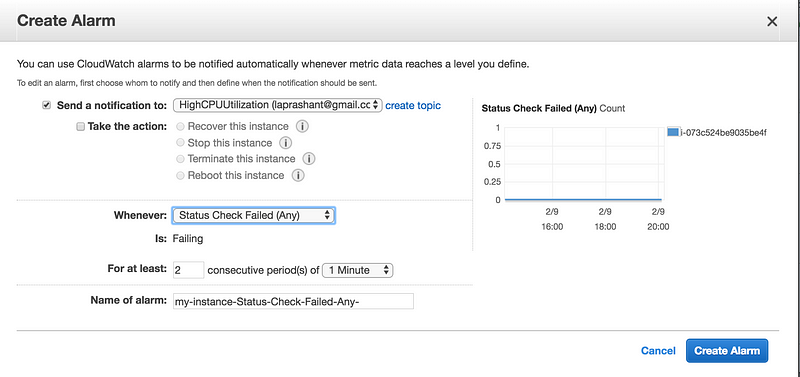
* You can create new SNS notification or use the exisiting one(I am using the existing one create in earlier example of high CPU utilization)
* In Whenever, select the status check that you want to be notified about(options Status Check Failed(Any), Status Check Failed(Instance) and Status Check Failed(System)
* In For at least, set the number of periods you want to evaluate and in consecutive periods, select the evaluation period duration before triggering the alarm and sending an email.
* In Name of alarm, replace the default name with another name for the alarm.
* Choose Create Alarm.
- Let’s write the terraform code
resource "aws_cloudwatch_metric_alarm" "cpu-utilization" {
  alarm_name                = "high-cpu-utilization-alarm"
  comparison_operator       = "GreaterThanOrEqualToThreshold"
  evaluation_periods        = "2"
  metric_name               = "CPUUtilization"
  namespace                 = "AWS/EC2"
  period                    = "120"
  statistic                 = "Average"
  threshold                 = "80"
  alarm_description         = "This metric monitors ec2 cpu utilization"
  alarm_actions             = [ "${var.sns_topic}" ]
dimensions = {
    InstanceId = "${var.instance_id}"
  }
}


resource "aws_cloudwatch_metric_alarm" "instance-health-check" {
  alarm_name                = "instance-health-check"
  comparison_operator       = "GreaterThanOrEqualToThreshold"
  evaluation_periods        = "1"
  metric_name               = "StatusCheckFailed"
  namespace                 = "AWS/EC2"
  period                    = "120"
  statistic                 = "Average"
  threshold                 = "1"
  alarm_description         = "This metric monitors ec2 health status"
  alarm_actions             = [ "${var.sns_topic}" ]
dimensions = {
    InstanceId = "${var.instance_id}"
  }
}alarm_name– The descriptive name for the alarm. This name must be unique within the user’s AWS accountcomparison_operator– The arithmetic operation to use when comparing the specified Statistic and Threshold. The specified Statistic value is used as the first operand. Either of the following is supported:GreaterThanOrEqualToThreshold,GreaterThanThreshold,LessThanThreshold,LessThanOrEqualToThreshold.evaluation_periods– The number of periods over which data is compared to the specified threshold.metric_name– The name for the alarm’s associated metric.namespace– The namespace for the alarm’s associated metric.period– The period in seconds over which the specifiedstatisticis applied.statistic– The statistic to apply to the alarm’s associated metric. Either of the following is supported:SampleCount,Average,Sum,Minimum,Maximumthreshold– The value against which the specified statistic is compared.alarm_actions– The list of actions to execute when this alarm transitions into an ALARM state from any other state. Each action is specified as an Amazon Resource Name (ARN).dimensions– The dimensions for the alarm’s associated metric.
- We need to modify our SNS module a little bit where the output of SNS arn will act as a input to this cloudwatch module.
output "sns_arn" {
  value = "${aws_sns_topic.my-test-alarm.arn}"
}- Same way output of EC2 module will act as an input to cloudwatch module
output "instance_id" {
  value = "${element(aws_instance.my-test-instance.*.id, 1)}"
}
- There is a bug in terraform code, where I can’t specify multiple instances
output "instance_id" {
  value = "${aws_instance.my-test-instance.*.id)}"
}
- If we try to use the above it’s will fail due to below error
Error: Incorrect attribute value type

  on cloudwatch/main.tf line 12, in resource "aws_cloudwatch_metric_alarm" "cpu-utilization":
  12: dimensions = {

Inappropriate value for attribute "dimensions": element "InstanceId": string
required.


Error: Incorrect attribute value type

  on cloudwatch/main.tf line 29, in resource "aws_cloudwatch_metric_alarm" "instance-health-check":
  29: dimensions = {

Inappropriate value for attribute "dimensions": element "InstanceId": string
required.
- Final CloudWatch terraform code
module "cloudwatch" {
  source      = "./cloudwatch"
  sns_topic   = "${module.sns_topic.sns_arn}"
  instance_id = "${module.ec2.instance_id}"
}
GitHub Link
https://github.com/100daysofdevops/21_days_of_aws_using_terraform/tree/master/cloudwatch
Looking forward for you guys to join this journey
- Website: https://100daysofdevops.com/
- Twitter: @100daysofdevops OR @lakhera2015
- Facebook: https://www.facebook.com/groups/795382630808645/
- Medium: https://medium.com/@devopslearning
- GitHub: https://github.com/100daysofdevops/100daysofdevops
- Slack: https://join.slack.com/t/100daysofdevops/shared_invite/enQtNzg1MjUzMzQzMzgxLWM4Yjk0ZWJiMjY4ZWE3ODBjZjgyYTllZmUxNzFkNTgxZjQ4NDlmZjkzODAwNDczOTYwOTM2MzlhZDNkM2FkMDA
- YouTube Channel: https://www.youtube.com/user/laprashant/videos?view_as=subscriber
In addition to that, I am going to host 5 meetups whose aim is to build the below architecture.

- Meetup: https://www.meetup.com/100daysofdevops
- Day1(Nov 10): Introduction to Terraform https://www.meetup.com/100daysofdevops/events/266192294/
- Day 2(Nov 16): Building VPC using Terraform
- Day 3(Nov 17): Creating EC2 Instance inside this VPC using Terraform
- Day 4(Nov 23): Adding Application Load Balancer and Auto-Scaling to the EC2 instance created on Day 3
- Day5(Nov 24): Add Backend MySQL Database and CloudWatch Alarm using Terraform
Nice